Environmental Preservation
Reduction of Greenhouse Gas Emission
Targets
By positioning ourselves for various countermeasures for global warming, one of our most important issues to tackle, we are trying to implement activities to realize a low-carbon society by developing approaches on carbon management such as deployment of energy-saving equipment, changing into clean fuel, and thorough energy-saving activities by establishing our Expert Committee.
Our Target for Environmental Activities
The medium-term target for 2020 will be maintained as is, and for FY 2014 we will set the following target aimed at achieving the target for 2020 and implement activities accordingly.
- Short-term reduction target value (FY 2014)
“Reduce GHG emission unit within our domestic group by at least 1% compared to FY 2013.” - Mid-term target in 2020
“By the fiscal year of 2020, try to reduce GHG emissions within our domestic group by 25% compared to our benchmark year(1990).”
Setting a Medium to Long-Term Greenhouse Gas Reduction Target
In aim of our shared global goal of reducing greenhouse gases by half by 2050, we have set a medium to long-term greenhouse gas reduction target in 2013. While previous medium to long-term targets have only aimed to reduce the greenhouse gases produced through the activities of Yokohama Rubber and domestic Group companies, the recently set target not only covers the activities of all Group companies throughout the world, it also covers our entire value chain that encompasses emissions when customers use our products, emissions from the procurement of raw materials and materials, and emissions from the disposal of products.
Going forward, based on this new target we will devise a roadmap for achieving our target while having internal discussions through various committees and among management employees. We plan to establish a concrete action plan for the GD100 Phase IV that studies have already commenced for.
- Long-term target:
By 2050 reduce the CO2 emission produced throughout the Group's entire value chain by at least 50% of that in the base year (2005) - Mid-term target:
By 2030 reduce the unit base of CO2 emissions per net sales by at least 40% of that in the base year (2005)
Financial Risks of our Businesses where Climate Change may Impact
1. Critical Risks due to Regulations
Around the world regulations aimed at preventing global warming are becoming stricter and in order to support these regulations it is expected that capital investments and product development costs will increase. There are concerns of significant increases in energy costs being triggered by increased costs for energy supply companies. Furthermore, if it is not possible to support these regulations, it could lead to a decrease in production volume in the event of suspended plant operations or damage to the corporate image.
2. Critical Risks due to Physical Influence
Our company is producing and distributing seasonable commodities such as snow tires; the amount of snowfalls or fluctuation of outside temperature owing to climate change might lead to a reduction in snow tire sales. Any climate change in the production areas of natural rubber may affect the steady procurement of raw materials, cause the cost of raw materials to increase, or cause production volumes of key products to decrease. Furthermore, the occurrence of large-scale natural disasters by global warming could make it difficult to continue production activities depending on the region.
3. Other Critical Risks
As people become more aware of energy conservation with the advance of global warming, the consumer behavior of general consumers could shift from ownership-based consumption to shared consumption. There are concerns that this type of change in behavior could lead to a decrease in demand for our products.
Financial Opportunities through Climate Change
1. Major Opportunities through Regulations
As the need for the commodities to meet environmental regulations may grow rapidly, it might lead to great business opportunities as we go about the development of products to meet those requirements.
- Example 1: Product development of regenerative energy such as solar energy generation, or product development and launching that can meet regulations on vehicle fuel consumption.
- Example 2: Product development and launching of tires along with the ratio increase in electrical cars.
- Example 3: Product development (other than tires) along with the ratio increase in electrical cars (fuel batteries, high-pressure hydrogen hose, etc.)
- Example 4: Mandatory installation of tire pressure monitoring system along with the legal regulations of air pressure control of tires.
- Example 5: Inner tire materials with lesser tire pressure leaks according to the legal regulations as to tire pressure control.
2. Major Opportunities through Physical Influence
Actualize the needs of marine related products due to water surface elevation and their product development.
Product development of sealing materials to alleviate temperature rise in the house, thermal insulation materials on the rooftop, etc.
Providing heavy equipment related to the construction to brace for flood (example: high-pressure hoses, conveyor belts or that kind, or tires for heavy construction vehicles).
3. Other Major Opportunities
Boost the sales of environmentally-friendly products (our commodities to alleviate climate change).
We can expect sales growth on a consolidated basis; alleviation and adaption to climate change is a worldwide issue and such business management should become global as well.
Participation in “National Campaign” to Prevent Global Warming
We are participating in a “National Campaign” (Challenge 25) to prevent global warming as a nation. As a member of Challenge 25, we post our President's message for both the Environment Month in June and Energy Saving Month in February at business locations; also, we are trying to promote corporate-wide Cool Biz and Warm Biz for our personnel to adopt.
Emission Volume of Greenhouse Gases within Domestic and Overseas Group Companies
During FY2013, greenhouse gas emissions at domestic group companies and overseas production bases were 610,000 tons -CO2, with domestic group companies accounting for 49% of emissions, and overseas production bases accounting for 51% of emissions.
Greenhouse gas emissions at domestic group companies and overseas production bases
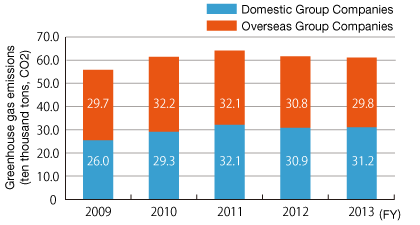
- The accounting period for the fiscal year of 2011 is from April to December. As such, data for the generated amount from January to March 2011 (fiscal year of 2010) has been added to this to provide a tally for the full calendar year.
- Calculation method of greenhouse gas (GHG): we are complying with the “Manual for Greenhouse Gas Emission Volume Calculation and its Reporting” issued by Ministry of the Environment and Ministry of Economy, Trade and Industry.
Calculation of Scope 3
As a company that aims to contribute to environmental preservation, we believe that understanding and disclosing greenhouse gas emissions as a manufacturer involved in the car-oriented society are important for promoting activities aimed at the reduction of greenhouse gas emissions on a global level. Based on these aims, we have decided to not only calculate Scope 1*1 and Scope 2*2, but to also calculate Scope 3.*3 The calculation was conducted in accordance with the GHG Protocol*4, which is the default standard for companies and other organizations for calculating and reporting greenhouse gas emissions. As a result of the corporate activities of Yokohama Rubber during FY2013 greenhouse gas emissions (Scope 1 + 2) were 657 thousand tons (CO2), and greenhouse gas emissions for the entire value chain including indirect emissions (Scope 1 + 2 +3) were 23,958 thousand tons (CO2). Scope 3 accounted for 97% of this, while use of products was 80%. While this calculation includes some elements based on scenarios, and while it will be necessary to make efforts to improve the accuracy of the calculation method and other elements going forward in order to acquire more accurate values, these results are used in the implementation of activities aimed at reducing greenhouse gas emissions.
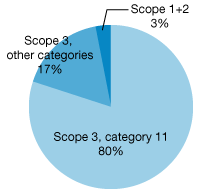
- *1. Scope 1: Direct emissions of greenhouse gases by the company (example: heavy oil combustion at factories)
- *2. Scope 2: Indirect emissions of greenhouse gases through energy used by the company (example: energy used at offices)
- *3. Indirect emissions of greenhouse gases outside the scope of the company’s activities (examples: emissions from the mining of raw materials, logistics and distribution, the use of products, disposal, etc.)
- *4. GHG Protocol: Sponsored by WBCSD (World Business Council for Sustainable Development) and WRI (World Resources Institute; a think tank from the US)
Verification of greenhouse gas (GHG) emissions
The verification of a third party was received in order to verify the reliability of GHG emission calculation information.
Third-party greenhouse gas verification report
- Japanese version(PDF:0.97MB)
- English version(PDF:92KB)
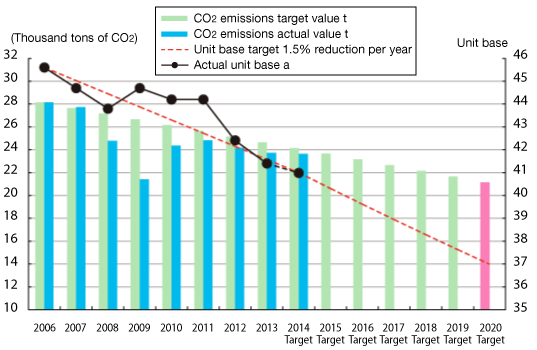
Reducing CO2 Emission Volume during Transportation
Since Yokohama Rubber is classified as Known Shipper, we are conducting our reduction measures together with our business partners by establishing an aggregation system to manage CO2 emission volume, energy consumption, and so on within the limit of property rights set forth by the law such as products, half-finished products, industrial waste, and so forth.
In order to address these, we are developing various reduction activities by targeting at least a 1% improvement of the unit base per energy consumption every year; as for CO2 emission volume, we are targeting a 25% reduction (compared to the fiscal year of 2006) by the fiscal year of 2020 as a medium-term goal.
Addressing on Tires Group
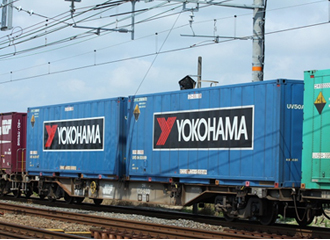
1)Advancement of modal shift
- Increasing adoption of ferries to transport tire products to the particular areas (Sapporo, Fukuoka, Sendai)
- Expansion of rail road routes
2) Addressing on effective transportation
- Reduction of unnecessary transportations introducing proper volume of inventories and placement of transportation bases.
3) Integrated efforts with carriers to improve fuel efficiency
- Promotion of the adoption of fuel-efficient cars in an aim for improved fuel efficiency
- Conduct regular fuel inspections and employ fuel saving methods in order to capture fuel economy improvements as a transportation company
Addressing on MB (multiple business) Group
Advancement of modal shift
- Expansion of rail road routes in remote transportation in locations such as Hokkaido
- Expansion of ferry transportation
CO2 emission volume related to MB logistics for a year from January to December 20132 amounted to 4,140 tons, reduced by 33% compared to the fiscal year of 2006 (6,123 tons).
Unit base of the energy was 41.4KL per million tons, owing to the increased use of JR freight and the increase of ferry transportations.
Compared to the target of a 1% reduction per year with the results for FY2006 (53.9KL per million tons) as the base year (a 7% reduction by FY2013), the reduction of 23% that was achieved (12.5KL per million tons) marks a significant improvement.
In the expansion of the modal shift, we achieved results of 20.5% in FY2013, (ton-kilo-based) compared to 6.8% in 2007 (no data for 2006).
Streamlining of Transport Energy
As Yokohama Rubber Group's effort to reduce CO2 emission volume and improve the unit base of the energy in the fiscal year of 2013, we promoted a modal shift (expanded use of ferry and rail transportation).
While the transportation amount increased by approximately 0.6% during FY 2013, CO2 emissions during transportation were reduced by 1.8% to 23,740 tons per year (down 420 tons year-on-year). The unit base per energy consumption was 41.4kl per million ton kilometers, an improvement of 2.4% year-on-year.
Major Improvements
[Tire Group]
- A high-level ferry utilization rate of 79% similar to the previous year was maintained for shipments to specific regions (Sapporo, Fukuoka, and Sendai).
- Rail transportation to the Kyushu region was 420 services per year, an increase of 100 services year on year.
- The modal shift achievement rate for tire product transportation was 220%, similar to the previous year.
- We employed fuel saving methods based on actual fuel consumption at 90% of land shipments in order to capture fuel economy improvements as a transportation company.
[MB Group]
- For shipments to remote areas such as Hokkaido, the modal shift achievement rate was improved from 18.1% in FY2012 to 20.5% in FY2013.
Rail transportation
Cases of Initiatives During FY 2013
The following energy conservation activities were conducted. The results of these activities contributed to a reduction in CO2 emissions.
Development of run-flat tire dedicated vulcanization specifications
Background behind the development of vulcanization specifications
Because run-flat tires with reinforced sides that have thick reinforced liners on the sides are highly rigid, they require high-pressure vulcanization molding.
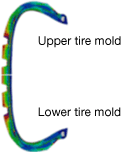
For this reason, a high-pressure nitrogen gas vulcanization method in which steam is enclosed inside the bladder during the first half of vulcanization molding and high-pressure nitrogen gas is subsequently gradually enclosed is desirable. However, with run-flat tires, condensed water coming from steam becomes detained in the lower part inside the bladder and the temperature decreases in lower mold of the tire, causing the progress of the vulcanization reaction to be slowest for the inner section of the lower mold for the thick side. On the other hand, when nitrogen gas is enclosed inside the bladder during the latter half of the vulcanization molding, due to the difference in gravity the steam becomes compressed in the upper part of the bladder and the temperature rises, and the amount of heat on the tire provided by the upper tire mold grows larger than that provided by the lower tire mold (Figure 4).
-
Tire cross section
-
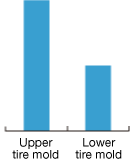
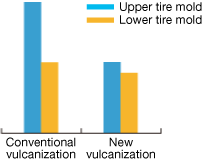
Figure 4. Amount of heat provided on tires with conventional vulcanization
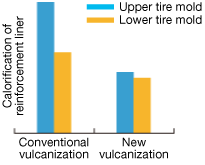
Because the amount of heat provided to the lower tire mold is low as a result, vulcanization molding for a long period of time is needed. However, at the same time excessive heat is applied to the upper tire mold, causing the physical properties of the lower tire mold to be inferior.
When the upper tire mold with inferior physical properties runs without any compressed air pressure, this results in tearing, and this makes it necessary for the reinforcement liner to be thick.
Development of new vulcanization molding specifications
In response, we underwent a variety of basic research to verify that the temperature difference between the upper tire mold and lower tire mold is controlled by the pressure exerted on the inside of the bladder, and subsequently succeeded in the development of a new control technology for equalizing the temperature inside the bladder during tire vulcanization molding.
This new technology has enabled a significant decrease in temperature in the upper part of the bladder (Figure 6), the equalization and improvement of physical properties (Figure 7), and a reduction (weight reduction) in the thickness of the reinforcement liner.
-
Figure 6. Amount of heat provided on tires with new vulcanization
-
Figure 7. Tire physical properties with new technologies
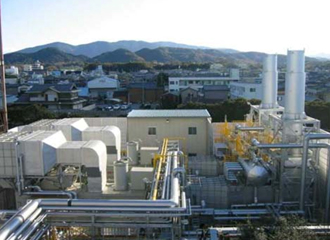
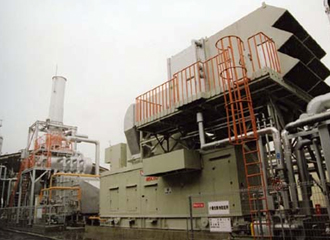
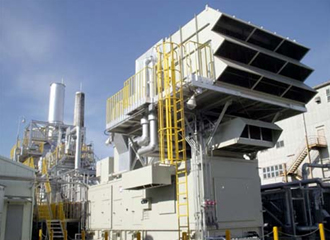
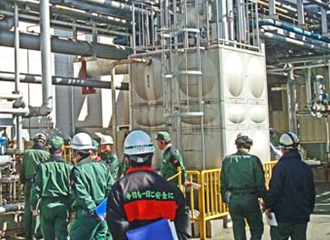
Full Operation of Co-generation Systems
At tire plants that use a large volume of energy and steam, it is possible to make a significant reduction in CO2 emissions through the adoption of co-generation systems that supply energy and steam at the same time. As of FY 2013, Yokohama Rubber has completed the introduction of co-generation systems at four domestic plants. As a result of continuous 24-hour operations, approximately 60% of the energy and nearly all of the steam used by plants has been supplied, enabling us to achieve a CO2 reduction and a reduction in the power purchased from electric companies
-
Mie Plant co-generation system
-
Mishima Plant co-generation system
Shinshiro Plant co-generation system
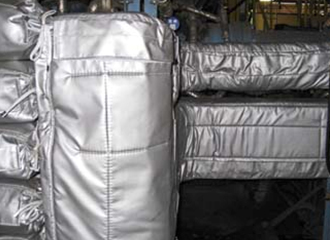
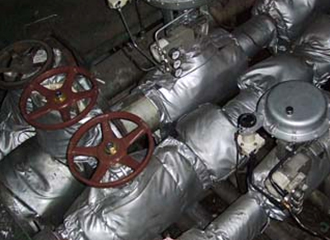
Energy Saving Improvements to Job Sites Through Heat Insulation Materials
Because insulation fitting the measurements of our equipment and piping is not possible using the heat insulation products that are available, we conduct the manufacturing and installation of heat insulation materials internally.
Since FY 2007 we have installed heat insulation materials to cover steam pipework and conducted energy-saving activities to prevent heat release.
We continued to install heat insulation materials to cover steam pipework during FY 2013.
Pipe insulation
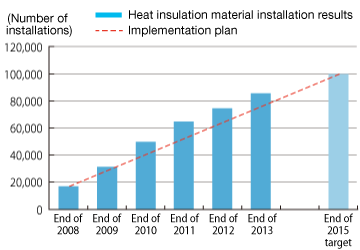
Number of heat insulation material installations
A cumulative total of 85,000 heat insulation material installations has been made at all production facilities as of 2013.
- * The accounting period for the fiscal year of 2011 is from April to December. As such, data for the generated amount from January to March 2011 (fiscal year of 2010) has been added to this to provide a tally for the full calendar year.
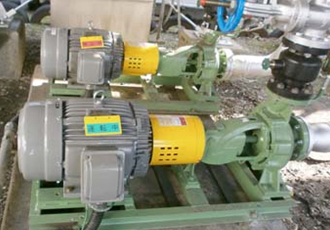
Efficiency improvements in motors and pumps at production facilities
We updated motors and pumps at production facilities that consume high quantities of energy to more efficient models. Energy savings of 50% were achieved compared to the previous equipment.
Highly-efficient pump equipment
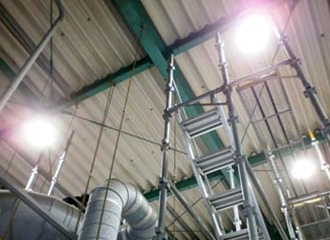
Updating mercury lamps to LED lighting
The mercury lamps uses for ceiling lighting in factory buildings were updated to LED lighting. Energy savings of 70% were achieved compared to the previous equipment.
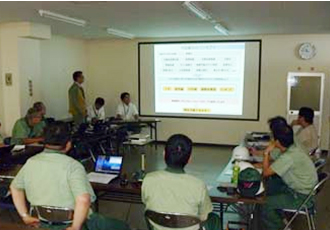
Energy-Saving Technology Committee
We have held the Energy-Saving Technology Committee. The committee produces results through energy management corresponding to the Act on the Rational Use of Energy, the introduction of energy-saving equipment, and energy-saving improvement activities.
Energy-Saving Technology Committee
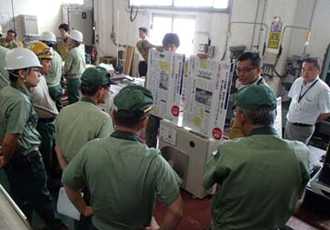
Energy-Saving Month Activities
Based on the slogan of “saving energy together,” we started preparations three months prior to our energy-saving month in February. Substantial outcomes based on the accumulation of small efforts were achieved thanks to the integrated efforts that were made by the production department, equipment maintenance department, and administration department at plants.
-
PR activities during the energy-saving month
-
Energy-saving patrol activities
Cases of energy savings with equipment
- Renewal to highly efficient lighting equipment and expanded adoption of LED lamps
- Renewal to highly efficient heat pump air conditioners
- Renewal to highly efficient power transformer
- Renewal to highly efficient pumps
- Increasing adoption of power inverters in fan pumps
- Decrease of compressed air pressure in factories
- Improving high efficiency of the temperature controlling machines.
Promotion of Energy-Saving Activities at the Headquarters Building
We believe that GHG reduction activities are important not only for operation sites, but also for buildings and offices throughout the Group, and we accordingly promote various energy-saving activities at our offices.
Yokohama Rubber signed the EEB Manifest covering energy efficiency within buildings and offices in December 2009 that has been put forth by the World Business Council for Sustainable Development (WBCSD), a council that the Group participates in. As a first step, we have set a greenhouse gas emissions reduction target for the headquarters building and we have implemented various energy-saving initiatives.
As a result of further strengthened initiatives in response to requests to save energy last summer, we achieved a 40.8% reduction during FY 2013 compared to the base year of FY 2009.
Going forward we will set challenging targets for offices in Japan and overseas besides our headquarters as we work to save energy and reduce greenhouse gas emissions.
CO2 Reduction Targets for the Headquarters Building
Reduce GHG emission by 25% by 2020 compared to the base year of 2009
Energy-Saving Policy for the Headquarters Building
In addition to energy-saving activities and initiatives to be participated in by all staff members, hardware improvements are to be implemented, including the adoption of highly-efficient lighting such as LED, improvements to air conditioning equipment, insulation of the building roof, saving energy used for OA equipment, and updating moving equipment with top-run products.
Changes in Greenhouse Gas Emissions by the Headquarters Building
| Base year of 2009 |
2010 | 2011 | 2012 | 2013 | |
|---|---|---|---|---|---|
| CO2 emissions(t-CO2) | 1,743 | 1,593 | 1,174 | 1,087 | 1,032 |
| Compared to base year (%) | 100% | 91.4% | 67.4% | 63.4% | 59.2% |
* As a result of the change in the accounting period for 2011, 2009 and 2010 are calculated from April to March, and years from 2011 onward are calculated from January to December.
Examples of administrative-based energy saving improvements
- Continuation and expansion of black illumination at the office
- Implementation of cool biz (May 14 to October 18) and warm biz (December 1 to March 31) programs
- Thoroughly ensuring that the lights are turned off when leaving seats and that the standby current of OA equipment is turned off when returning home
- During the energy-saving month of February, have department head conduct energy-saving patrols
- Improve awareness of energy-saving by visualizing the amount of energy used by the office
- Adoption of inverters for air-conditioning water cooling and warming equipment
- Use of fans and curators